Interface
Analytics
The densest screen in the set. Everything is on an 8px rhythm, and the only saturated colour in the layout is reserved for the one number that matters.
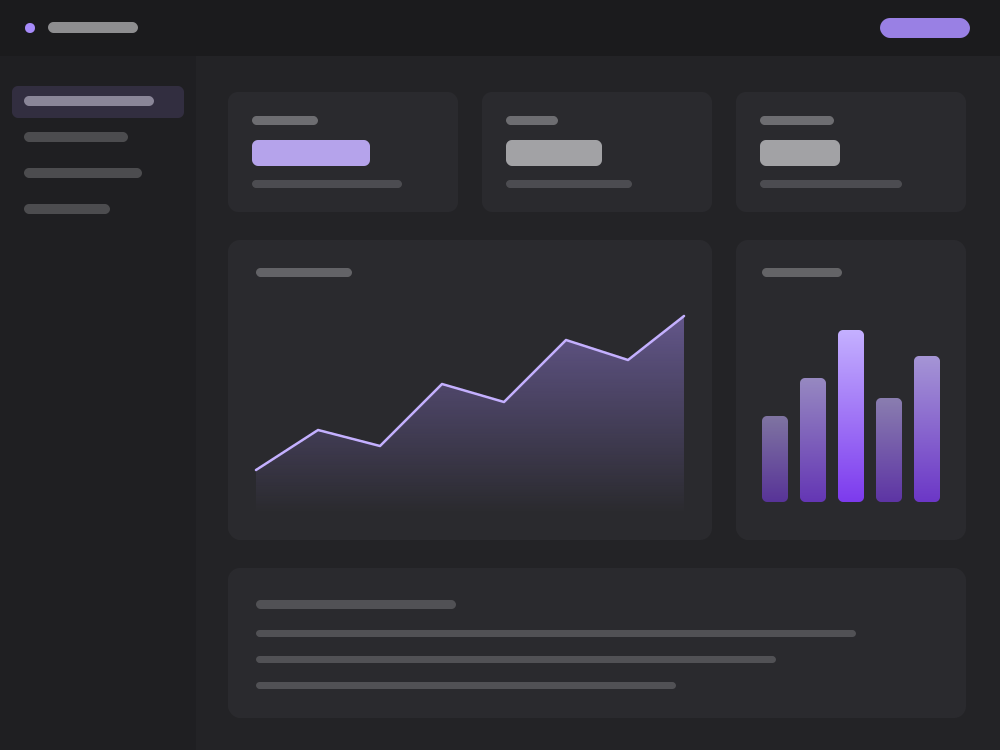
The briefA SaaS analytics dashboard with a sidebar, three stat cards, a trend chart and a table.
The densest screen in the set. Everything is on an 8px rhythm, and the only saturated colour in the layout is reserved for the one number that matters.
- Stat cards share one component shape, duplicated and re-typed.
- The area chart is a filled path plus a stroked path on the same points.
- Sidebar selection uses the accent at 14% rather than a solid fill.
- Surface
- Desktop · 1440 × 1024
- Layers
- 46
- Typeface
- Poppins
- Palette